- HOME
- PRODUCTS & SERVICES
GIS/GPS in Smart Cities/Transport METRIS — Big Data in Metro Transportation METRIS LiveQ: Real-time Truck Queues METRIS — Port Performance METRIS — GPS Tracking METRIS — Transport Planning Advanced GIS Analytics/Algorithms Transport Research Error Modeling Conflation GIS in Retail CLEO — Location Optimization Trade Areas Gravity Models Location-Allocation Models Enterprise GIS Strategic plan & cost-benefit analysis GIS Data Modeling
- RESOURCES
News & Commentary METRIS News & Press Reports Light Technical Geography 80-20 (nuggets for adults) Geography Kids' Hangout Technical GIS Publications METRIS Publications Associated projects NCRST VITAL
- ABOUT
Are Roads Longer Over Hills?
Val Noronha | The Geography 80-20 collection
Yes, they are. But by how much?
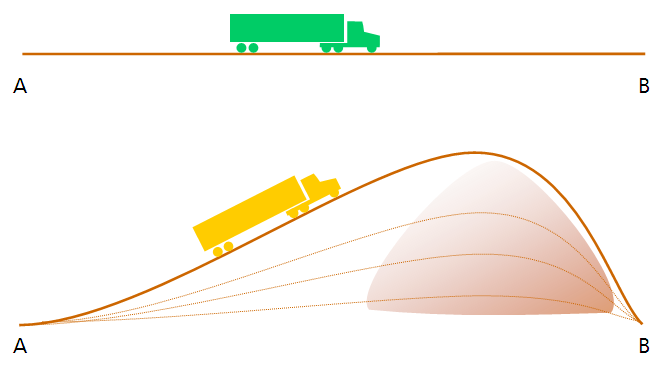
 In the
figure, we have a green truck plying a straight line between A and B. And a gold truck running over a hill
between the same end-points A and B. Both paths are absolutely straight, in the sense that you never move
the steering wheel. What does the elevation add to the length of the gold truck's path?
In the
figure, we have a green truck plying a straight line between A and B. And a gold truck running over a hill
between the same end-points A and B. Both paths are absolutely straight, in the sense that you never move
the steering wheel. What does the elevation add to the length of the gold truck's path?
First let's get a sense of how high hills are. Mount Everest is 8,848 meters tall, or 8.8 km. The earth's radius is 6,378 km. In other words Mount Everest is 1/1000 the radius of the earth. On a globe the size of a basketball, Everest would stick out as much as the thickness of a sheet of paper.
When we humans, under 2 meters tall, look at a hill, 1000 m tall, we see an enormous, forbidding height and difficult terrain. When we see the same distance of 1 km strung horizontally ahead, it makes a much smaller angle at our eyeballs, it's just a 15-minute walk and we don't think much of it.
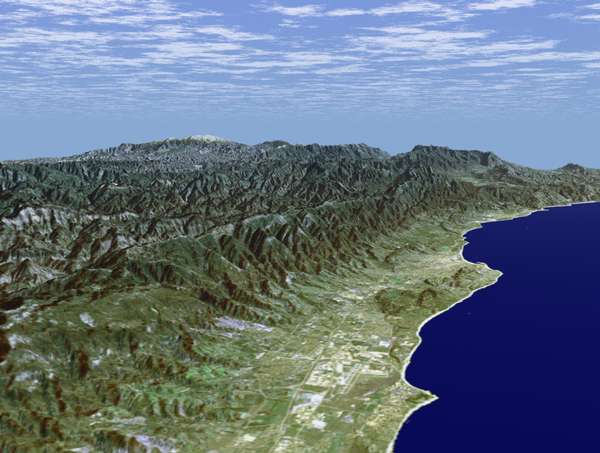 When cartographers make 3D diagrams, such as this
view of the hills over Santa Barbara (created by the Jet
Propulsion Laboratory from the Shuttle Radar Topography Mission
data), they exaggerate the vertical dimension by 10 to 30x for
it to look “right.”
When cartographers make 3D diagrams, such as this
view of the hills over Santa Barbara (created by the Jet
Propulsion Laboratory from the Shuttle Radar Topography Mission
data), they exaggerate the vertical dimension by 10 to 30x for
it to look “right.” 
So to answer the question above, the gradient on a steep road grade — one where you'll see warnings about runaway trucks — is about 8%. That's the “rise over run” language for a gradient, meaning 8 m of elevation (rise) for every 100 m of horizontal distance (run). Working out a little trigonometry, the angle of the slope (tan-1 0.08) is 4.57°, and cosec 4.57°=1.0032, which says that the length of the sloping face is just one-third of 1% (0.32%) longer than the horizontal.
There are exceptions. The world's steepest residential street, Baldwin Street in Dunedin, New Zealand, has a gradient of 1:2.86 or 35%, giving it a sloping length 6% greater than the horizontal extent.
We didn't attach numbers to the distances and elevations in the figure above, and it's not to scale, but the green truck does not have much of a distance advantage. The gold truck does have to labor against the gradient, which is perhaps compensated by tobogganing down the far slope, but that's a separate matter of engine load and fuel consumption. We're just talking about distance.
Weaving through traffic
In a similar vein, one would think that a car that weaves in and out of traffic on a freeway drives a greater distance. Yes, but how much greater? A lane is 3.6 m (12 ft) wide, but it takes a longitudinal distance of 50 to 150 m to execute a lane change. Call it 100 m, which is a fairly abrupt 3-second lane change at highway speed. We model this as a sine wave of wavelength 200 m (wavelength is measured over a full cycle of the wave, which on the road would amount to a lane change and back again), and amplitude 1.8 m (amplitude of a wave is half the distance from crest to trough, so that's 1.8 m on each side of the lane stripe for a total shift of 3.6 m). Working out a little calculus, we find that each change of lane adds all of 8 cm (less than 4 inches) to odometer distance.
Difficult to believe? Here's the math:
Waveform: y = 1.8 sin 2π/200 x
Arc length: r =  100 √ 1 + (1.8 x 2π/200 cos 2π/200 x)2 dx = 100.08
There's an easier calculation, simplifying this into straight-line geometry. Calculate the hypotenuse of a right triangle with sides 3.6 and 100.
√ 3.62 + 1002 = 100.064
which adds 6.4 cm rather than 8 cm, to be expected because we're approximating a curve by a straight line.
The conclusion from the lane-weaving and hill driving illustrations is the same: longitudinal distance is often under-rated. It forms a small angle at our eyes, and we traverse it so easily that we under-estimate its magnitude. We're more readily impressed by width and height.
Winding roads
There's a different angle on the issue of roads running over hills. A hilly road is typically winding. When maps are prepared, details of those curves are glossed over, depending on the map scale. This leads to gross undermeasurement of length. In the late 1990s we documented shortfalls of 5-20% on road lengths measured off digital maps. Compare that with the typical elevation effect of less than 1%. What we're saying is that the reason roads are longer over hills is not because of the rise and fall of elevation, but because roads tend to wind around on hills and that geometry isn't faithfully represented on maps.
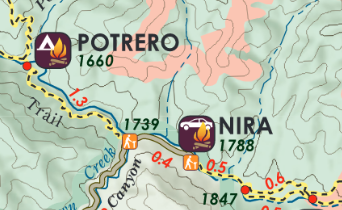 If you're planning a hike or bike ride on a winding road, and you estimate the distance by
using a map measuring wheel, you may be in for a surprise. Measuring the length of the black stippled line from
Potrero to Nira, for example, would probably yield half the actual hiking distance. That's why this map (from
Bryan Conant) annotates the route with the correct distance. It's worth the trouble to locate such good quality
hiking maps.
If you're planning a hike or bike ride on a winding road, and you estimate the distance by
using a map measuring wheel, you may be in for a surprise. Measuring the length of the black stippled line from
Potrero to Nira, for example, would probably yield half the actual hiking distance. That's why this map (from
Bryan Conant) annotates the route with the correct distance. It's worth the trouble to locate such good quality
hiking maps.
In a consulting job, we came across a fairly typical situation in which a county was receiving road maintenance funds from the state in proportion to the length of road in the county. Its roads were predominantly hilly, and they were sure they were being shortchanged. This was the reason. Their return on the consulting fee was several hundred thousand dollars.
Two things have improved since: (a) digital maps are now made from GPS data and are much better, doing more justice to curve detail, and (b) states and feds are learning about these problems, and using odometer distance rather than digital maps of inappropriate quality, to measure roads.

Tweet this URL
© Digital Geographic Research Corporation Contact us